Showing posts with label decision making. Show all posts

Tuesday, October 1, 2013

Call for Papers: Ethics, social responsibility and sustainability!


Deadline for submissions: October 31, 2013

Scandals have hit the airwaves in increasing numbers. Decisions were made that were not completely ethical and opens a debate on organizational management. Understanding how the social and economic factors create sustainable business helps to create higher levels of economic efficiencies. Emerald is seeking papers to cover ethical decision making and standards. More information http://www.emeraldinsight.com/authors/writing/calls.htm?id=4637

General Topics for Approval
  • social and economic consequences of misconduct in organization
  • ethical decision making: individual and group processes
  • the influence of national/regional institutional factors on the engagement in sustainable, ethical and/or socially responsible practices;
  • the impacts of sustainable, ethical and or socially responsible performance at different levels of analysis (e.g. institutional, organizational, and individual levels);
Articles can be empirical or theoretical oriented. All types of methods - quantitative, qualitative or combinations- are acceptable.
All manuscripts submitted to this special issue must follow the submission guidelines, available at:
http://www.emeraldinsight.com/products/journals/author_guidelines.htm?id=mrjiam

Submissions:

Submissions to MRJIAM are made using ScholarOne Manuscripts, the online submission and peer review system. Registration and access is available at
http://mc.manuscriptcentral.com/mrjiam, and authors should submit in the space dedicated to this special issue.

Wednesday, September 11, 2013

Are We Prone to Bias in Our Business and Recruiting Decisions?


We chronically evaluate others to determine status as a friend or foe. When such decisions are made on superficial information this can create large problems for organizations that push and promote those who were favored by their environment versus their skills.  The same concept can apply to companies that look at grade point average for recruiting without looking at the difficulty of earning that grade. Research by Swift et. al. (2013) delves into how these superficial decisions are made and how they can impact corporate recruiting.

Research has indicated that the majority of employers look at a candidates GPA without delving into the difficulty of obtaining those grades thereby limiting their recruiting potential. For example, a student who obtains an easy A without having to work for it is not inherently better than a student who earns a C from a school with high standards. One could make the argument that the student with an A is likely to be less prepared for success or failure than the one who received a more accurate C and understands a need for constant improvement. 

The attribution error is so common that it is difficult for employers to overcome anecdotal evidence to make solid decisions. Primarily it is a problem of assuming that the level of performance in one setting will translate into the same performance in another setting and that performance is based upon personal attributions. They are unable to view the important aspects of the situation and the inclusion of personality in the final performance outcome.  In other words, they simply make a surface assumption with no deeper analytical thought process. 

Lewin’s attribution equation is Behavior = Disposition + Situation.  Behavior as seen in terms of performance would be based on both a person’s disposition as well as their situation.  When attributes are situational but contributed to disposition there is a problem in the recruitment process. For example, is one CEO better than another only because they play cricket or maintained performance in an upward moving company? One could make the argument that the CEO who doesn’t play much golf but who was able to turn around a poor running company is the higher performer (i.e. Lee Iacocca). 

The researchers Swift, et. al (2013) used four studies to test the concept fundamental attribution errors in varying situations.  They found that attribution errors are a fundamental problem across a number of arenas with experienced professions. They also found that employees who performed well in favorable (easy) situations, or students earned high grades in colleges with high grade distributions, were more likely rated as superior performers. 

Performance measures can be accurate or inaccurate. At times performance measures can create structural bias that masks superior performance in difficult situations while enhancing mediocre performance in ideal situations. The results are perceptual based upon the information available to the professional making decisions to hire, promote, or admit. Yet even when situational information is known the far majority of professionals do not discount ease of performance attainment creating a bias in their hiring practices. 

The questions becomes do we make these types of errors throughout life? Absolutely! Whether we are discussing children in school, CEO’s, or people we meet in the street we make all types of assumptions. We base these assumptions on anecdotal information because we do not have deeper information. Yet even when this information is available we will often ignore it or not make the time to see beyond our surface assumptions. Critical thinking requires judging premises and looking for alternative explanations even if our social networks are convinced of their rightness.

You may read the entire report HERE.

Swift SA, Moore DA, Sharek ZS, Gino F (2013) Inflated Applicants: Attribution Errors in Performance Evaluation by Professionals. PLoS ONE 8(7)

Sunday, August 11, 2013

Emotion and Reason as Processes of Decision Making


There has been considerable discussion on emotion and rationality in the workplace. Some have argued that emotionality should always be second to rationality. Yet emotionality allows an opportunity to make quick responses while rationality is a process of reflection that leads to more exact outcomes. Both processes can work together to create accuracy and motivation in way that neither can do alone. 

There are two types of cognitive abilities one of which is related to quick reaction that does not require processing and the other a slower and more reflective process (Kahneman and Frederick, 2002). These are often seen as process 1 and process 2. Process 1 includes quick and automatic determinations like facial recognition while process 2 is more analytical like reflecting on math problems. 

These two processes impact one’s ability to respond to situations and events within our lives. Generally, those with emotional intelligence can delay the “knee jerk” reactions of process 1 to give better responses after using process 2. Under certain circumstances it is better to use process 1 to create efficiency in difficult situations but these should be tapered by the rationality of 2 to be most successful. 

The ability of human beings to reflect means that they also have the ability to learn from the past. It is this constant process of reflection and learning that makes better choices for the future. Those who do not use reflection with the analytical processes of 2 are continually subjected to the control of process 1 based in the heuristics they have developed in their lives. Their responses are automatic and sometimes not accurate.

Reflection and reason have an important function for predicting the likely outcomes of events. Rae writes in 1834 in the work New Principles of Political Economy, “The strength of the intellectual powers, gives rise to reasoning and reflective habits…brings before us the future…in its legitimate force, and urge the propriety of providing for it”.  Our thinking abilities and skills can understand the trends of the future and by aligning individual actions we can meet those challenges. 

As a system the tackling of problems today and focusing on the strategic solution desired in the future creates constant alignment. In organizations, or lives, where individuals wait until the problem is apparent and destructive before finding a solution are constantly stuck in reactive and procrastinate solutions where they are less effective. Knowing where an organization wants to go and solving problems to meet that future position saves considerable headache, poor choices, and resources.

The use of process 1 and process 2 are important for success in business. Those who rely heavily on the quick emotional process 1 will not be able to gauge their responses while those that rely heavily on process 2 will be more accurate in their decisions but will not be able to respond to situations quickly. Knowing how to manage process 1 and process 2 can develop accuracy and effectiveness.  One is not confined to either emotion or rationality but can use both effectively to make effective business decisions.

Kahneman, D. & Fredrick, S. (2002). Representativeness revisited: attribute substitution in intuitive judgement in Hueristics and biases: the psychology of intuitive judgment. T. Gilovich, D. Griffin and D. Kahneman, eds. New York: Cambridge University Press, pp. 49–81.

Tuesday, April 23, 2013

Reducing Errors in Market Projection


Projecting markets can be difficult for executives who want concrete answers to the potential decisions they are about to make. One of the strong signs of leadership is the ability to deal with ambiguous information. This means that decision makers may not have all of the information they need to make appropriate decisions. Each decision leads to the possibility of failure with significant financial costs. The use of statistical methods can be an enhancement to the decision making process through lowering levels of uncertainty. However, statistics alone can cause mistakes and are not substitutes for good judgment. Using multiple statistical analyses to make expensive projection calls can lower decision errors and lead to stronger choices that improve market choices. 

The Delphi Method:

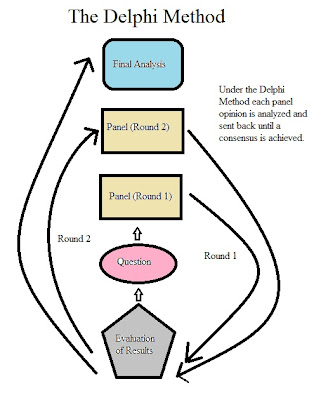
The Delphi Method was developed by Olaf Helmer while at the Rand Corporation. In the method participants answer questions about predictions, products, or services while not being able to interact with each other. Afterward the results are tabulated and then put within a quartile system to supply to experts. The experts provide their opinions based upon new information and those that fall into the outlining quartiles need to justify their answers. Projections often use only expert opinions while product research may use customer opinions.  The answers are then provided back to the original participants who also justify their answers. Each subsequent round creates additional consensus on opinions until there is a cluster around a single (or few opinions) that can be used to project markets.


The advantage of the Delphi Method is that larger bodies of experts are likely to be more accurate than decisions made by individuals. As each person continually adjusts their answers through repeated evaluation the entire process becomes more accurate. Eventually there will be a predominant opinion that can be used in evaluation and forecasting market trends. 

Imagine for a moment that you are an executive and you need to make a decision about an expensive investment. However, you are unsure if the environment will be right for this investment to pay off over the next five years. To create more clarity in your thinking you poll a number of experts within the city. They respond but their answers are scattered enough as to make a prediction both risky and unlikely. You analyze the data and ask the outliers (people with widely varying opinions) to justify their positions. As you keep running this process over and over the responses will regress to a more focused answer that can be used to make decisions. 

Cross-Impact Analysis:

The cross-impact analysis uses available data from the past to make predictions about the future. There is an assumption that past events influence future events. Typically a group of experts study correlations between events and present these within a matrix. The matrix then shows the probability from 0-1 of a particular event occurring. 

We can use an example of the probability that gas prices will rise if either of two events occur. The simplified example would not include all of the potential factors that would be included in a true analysis but does highlight how the process works. 

Events:                                    Probability of Event
Given Event                    Event X and Event Y
X:Plant Shuts Down               ----                   .2
Y:Trucker Strike                     .3                     ---

This simplified chart is stating that if a plant shuts down there is a 20% chance gas prices will raise. If there is a trucker union strikes there is a 30% chance that gas prices will raise. The example above would not be considered accurate as there are many more events that can be applied to a potential situation. It is used as an illustration only. An actual analysis of would also include all the potential factors, the chances of certain events occurring, and the potential outcomes when those events do occur. Such an analysis would have factor upon factor all connected together into a long probability string to predict future events.  It is beneficial to put it in a chart or graph form because it can be hard for people to keep these concepts organized in their head. 

The cross-impact analysis was adopted by the government and business community in the early 1970’s. There are various forms of this analysis using different types of formulas and methods of denoting probability. Some models might simply use a negative or positive sign to denote opportunities. Other methods might consider “enhancing” and “detracting” factors to particular events. 

This analysis is based on game theory. As each opponent picks a certain avenue to gain competitive advantage there are resulting probabilities for the next choice of actions. Each action creates more probabilities. The advantage in businesses is that they can both lead their opponent’s choices as well as pick better responses once the opponent has made choices. The end goal is to increase probabilities of success while reducing the probabilities of failure.  “Check mate” occurs when all of your opponent’s next choices result in their loss making the next move nearly useless. Your opponent will either end the game or pick from increasingly bad choices.

In the world of business, organizations attempt to predict potential advantages and detractors in order to create proper strategy. They conduct an environmental analysis to understand all of these potential possibilities and then use a cross-impact analysis to represent and track these strategic choices. The key is to create market advantages that result in higher levels of revenue and market share. The winner is that organization that makes choices that overcome market challenges and has the highest level of sustainable growth. As you can see when the organization wins, employees win, the executive wins, and the shareholders win.

Regression Analysis:

A regression analysis attempts to find the strength of relationships between independent and dependent variables. If there are a number of independent variables it is possible to express a regression analysis in a formula such as the following:


The regression analysis is often used for modeling and predicting particular relationships by analyzing how the dependent variable is influenced when one of the independent variables changes. This allows researchers to see if a particular change shows a relationship between two elements. For example, if one of the independent variables is changed and this results in a dependent variable change then we have a level of influence. Moving through each of the independent variables will allow for statistical measurements showing how each factor changes and adjusts the dependent variable. 

It must be remembered that the regression analysis does not prove that one variable causes another variable. It can only show that there is an association between the two variables and that one has an impact on the other. Truly understanding the causal relationship would require the adjustment of inputs that recreate events within a lab or similar type of experimental setting. Some researchers become confused between causation and correlation…even though there is an important distinction.

The regression analysis is a systematic method of understanding that can be used in business to understand influences of varying factors. For example, if a product is purchased more often because it is seen as red and therefore noticed by customers more often an experiment could be conducted to determine how these factors are associated. Perhaps it is the price in addition to the red color? This would require an evaluation of the various factors through the use of a regression analysis. 

The regression analysis first appeared in the literature by Legendre in 1805 as a method of least squares to understand orbits around the sun (Legendre, 1805).  The term “regression” was later used by Francis Galton to understand how tall people appear to regress in preceding generations down to the average of human height. Today the regression analysis is a major statistical method of understanding and analyzing association of factors in research. 

Dalkey, N. & Helmer, O. (1963). An experimental application of the Delphi Method to the use of experts. Management Science, 9 (3). 

Fitzsimmons, J. & Fitzsimmons, M. (2011). Service Management: Operations, Strategy, Information Technology (Seventh Edition). NY: McGraw-Hill. 

Heuer, R. & Pherson, R. (2011). Structured analytic techniques for intelligence analysis. CQ Press. ISBN :978-1608710188